
Step 1: Open the panel
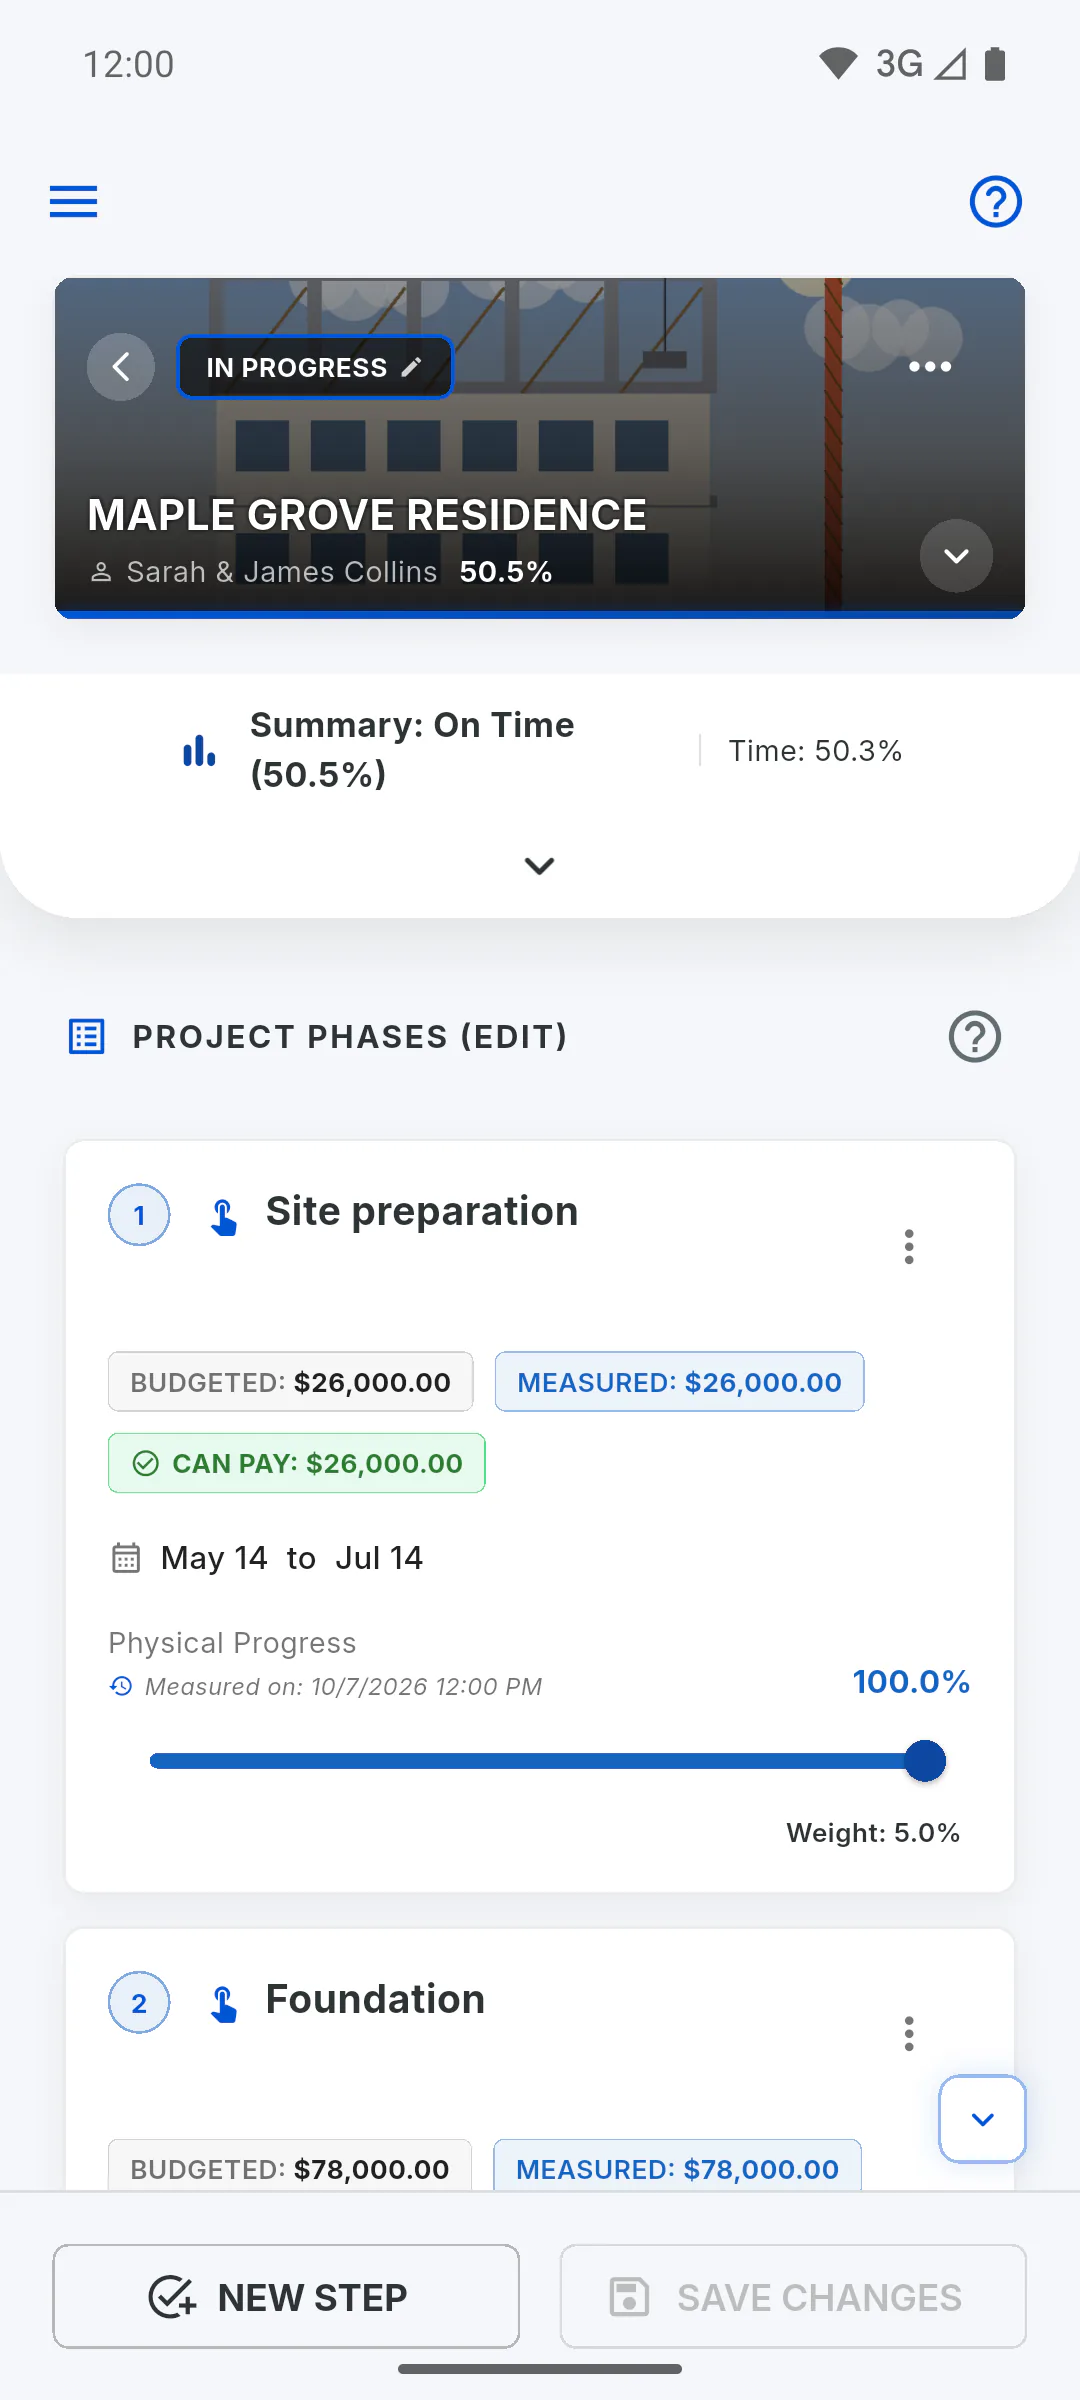
Open the project: people who manage it start on Schedule. The panel sits at the top and starts collapsed into a single line showing Summary (status and progress) and Time. Tap the arrow just below it to expand or collapse the full panel.
Step 2: Physical Progress
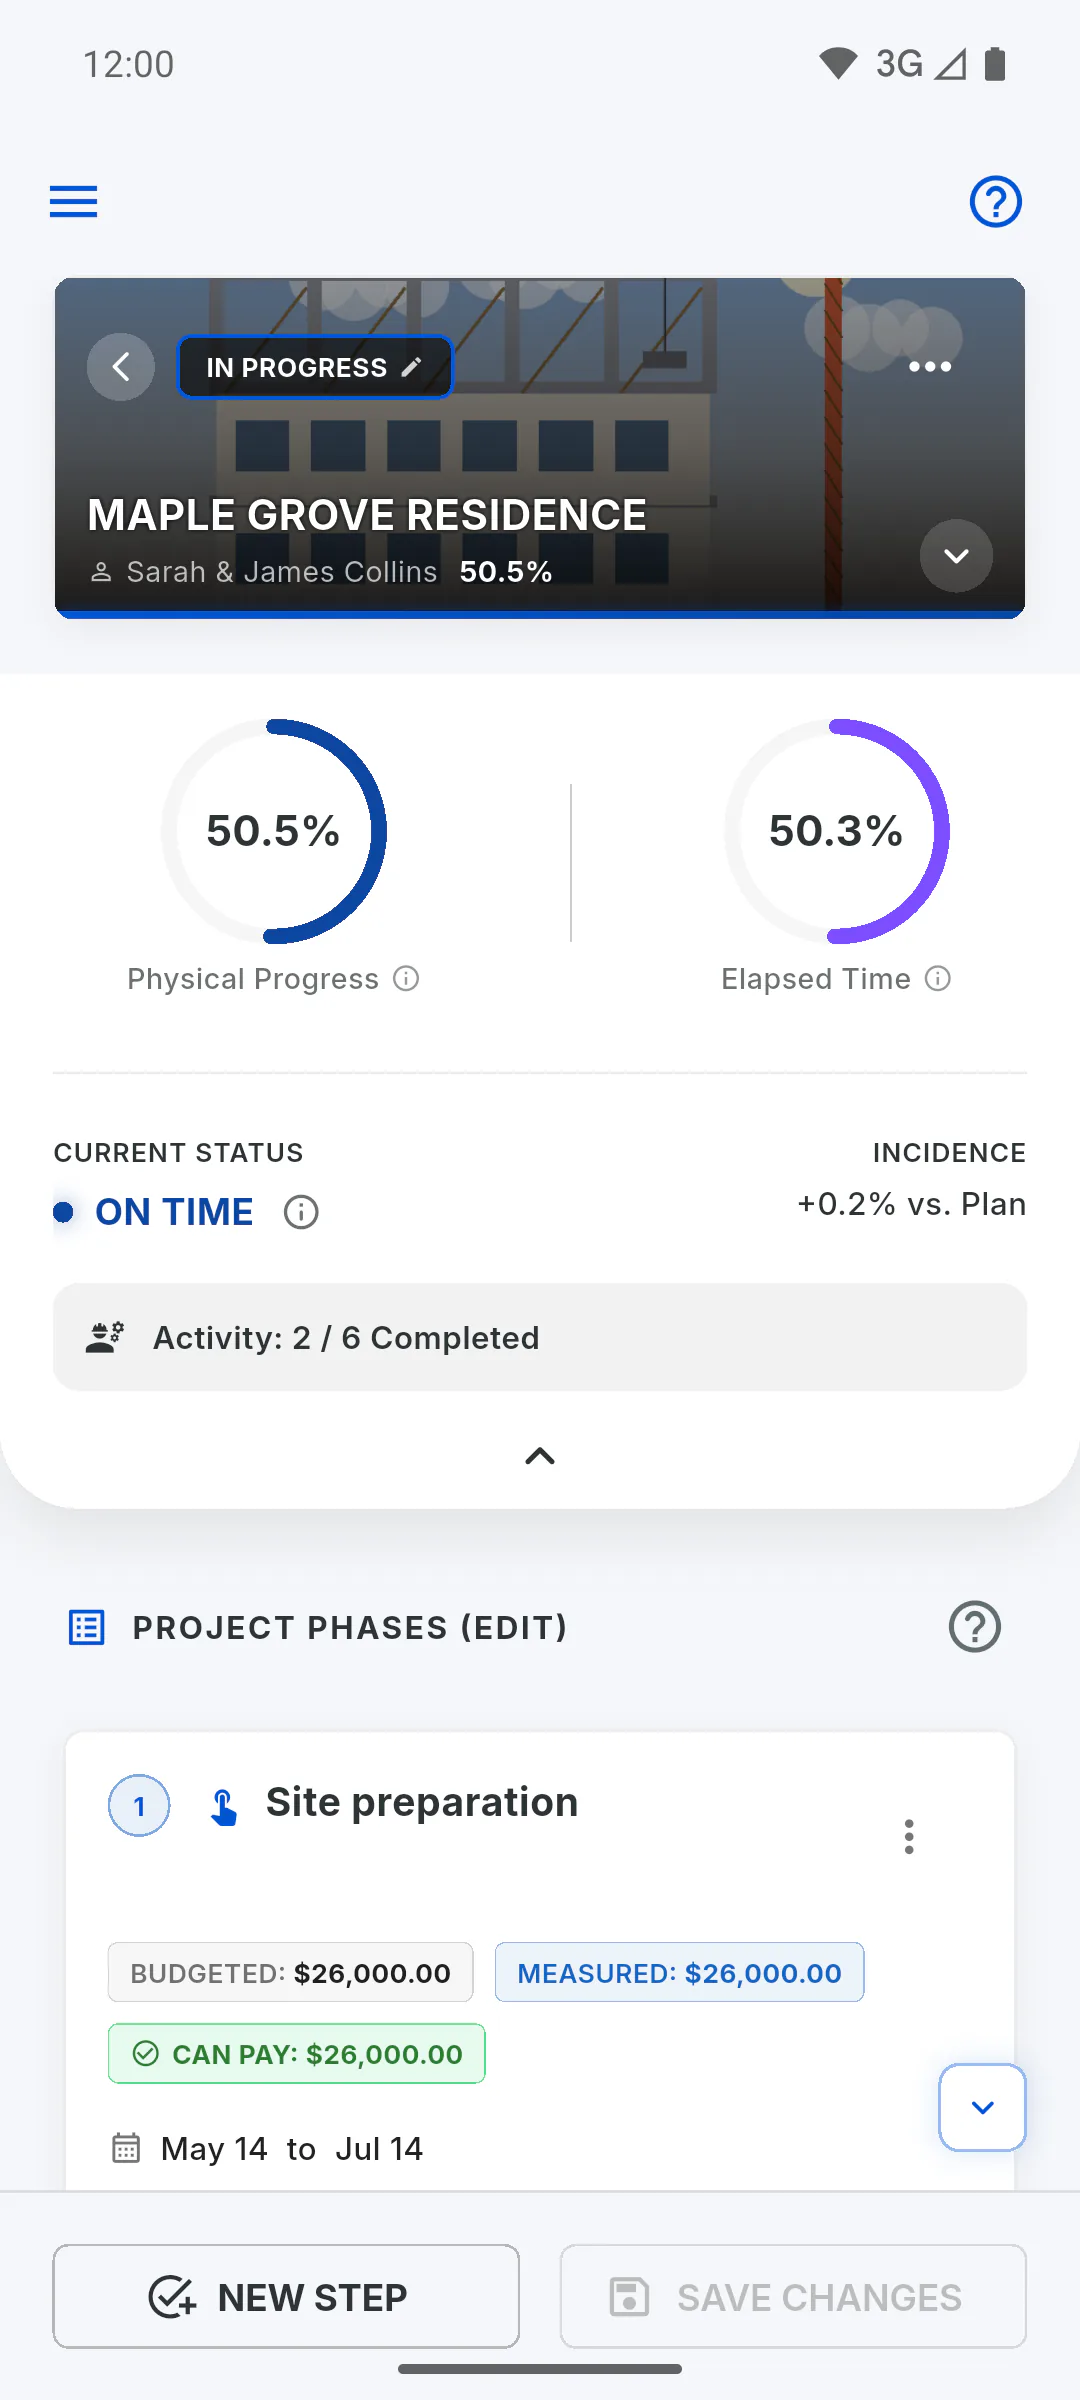
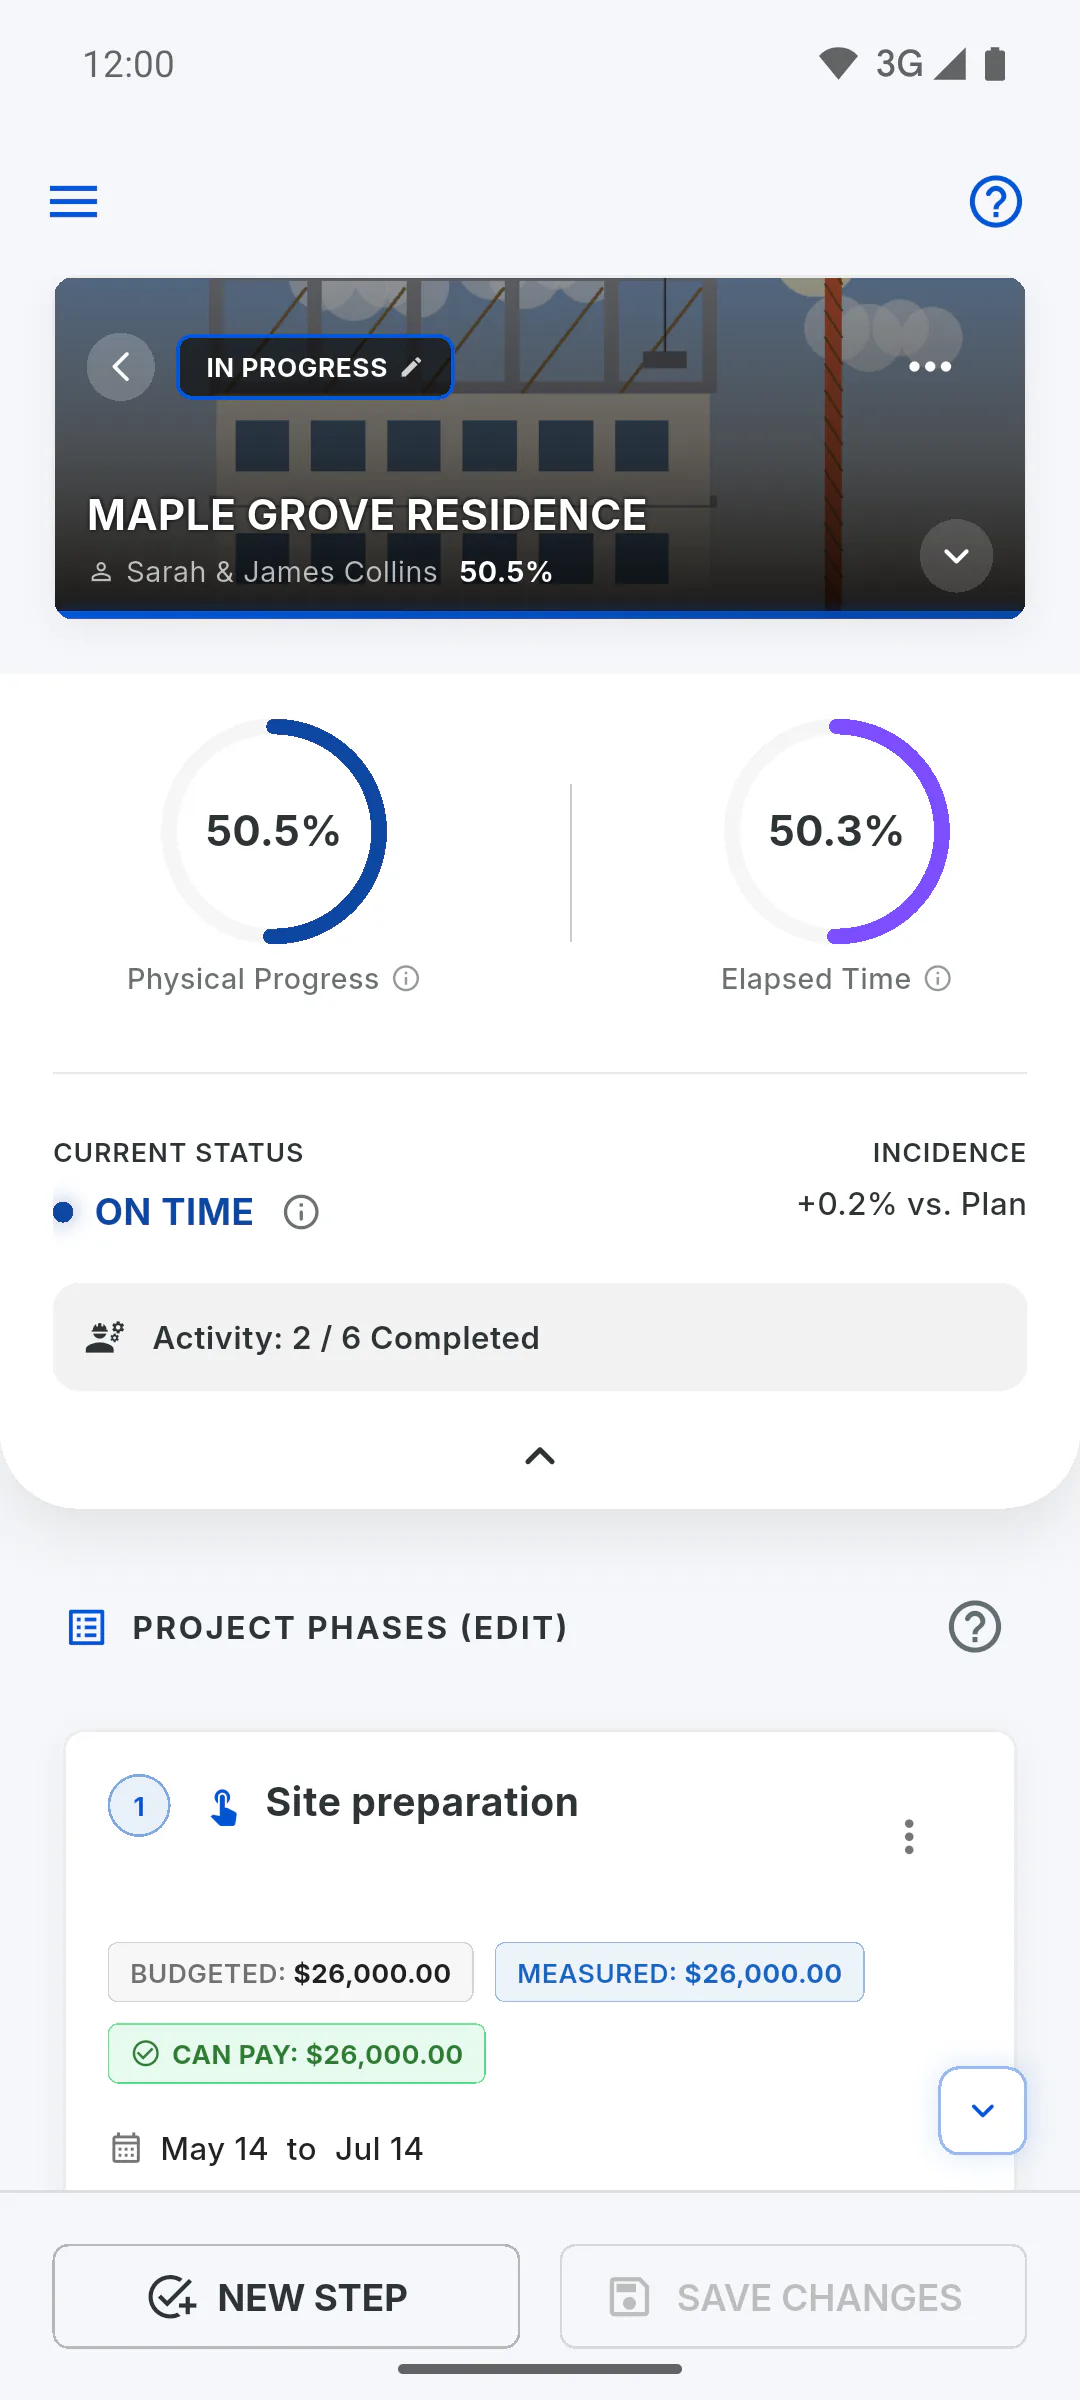
The Physical Progress gauge shows how much of the project has been built. It adds up the progress of the stages, weighting each stage by its share of the contract: a high-value stage counts more than a cheap one. Any part of the contract not yet in a stage counts as not done. Tap the gauge to see an explanation.
Step 3: Elapsed Time
The Elapsed Time gauge shows how much of the timeline has passed, from 0% to 100%, between the project's Start Date and Est. Delivery. Without both dates it stays at 0%, and tapping it shows Time schedule not calculated. Add the dates when you edit the project: How to edit a project's details
Step 4: Current Status
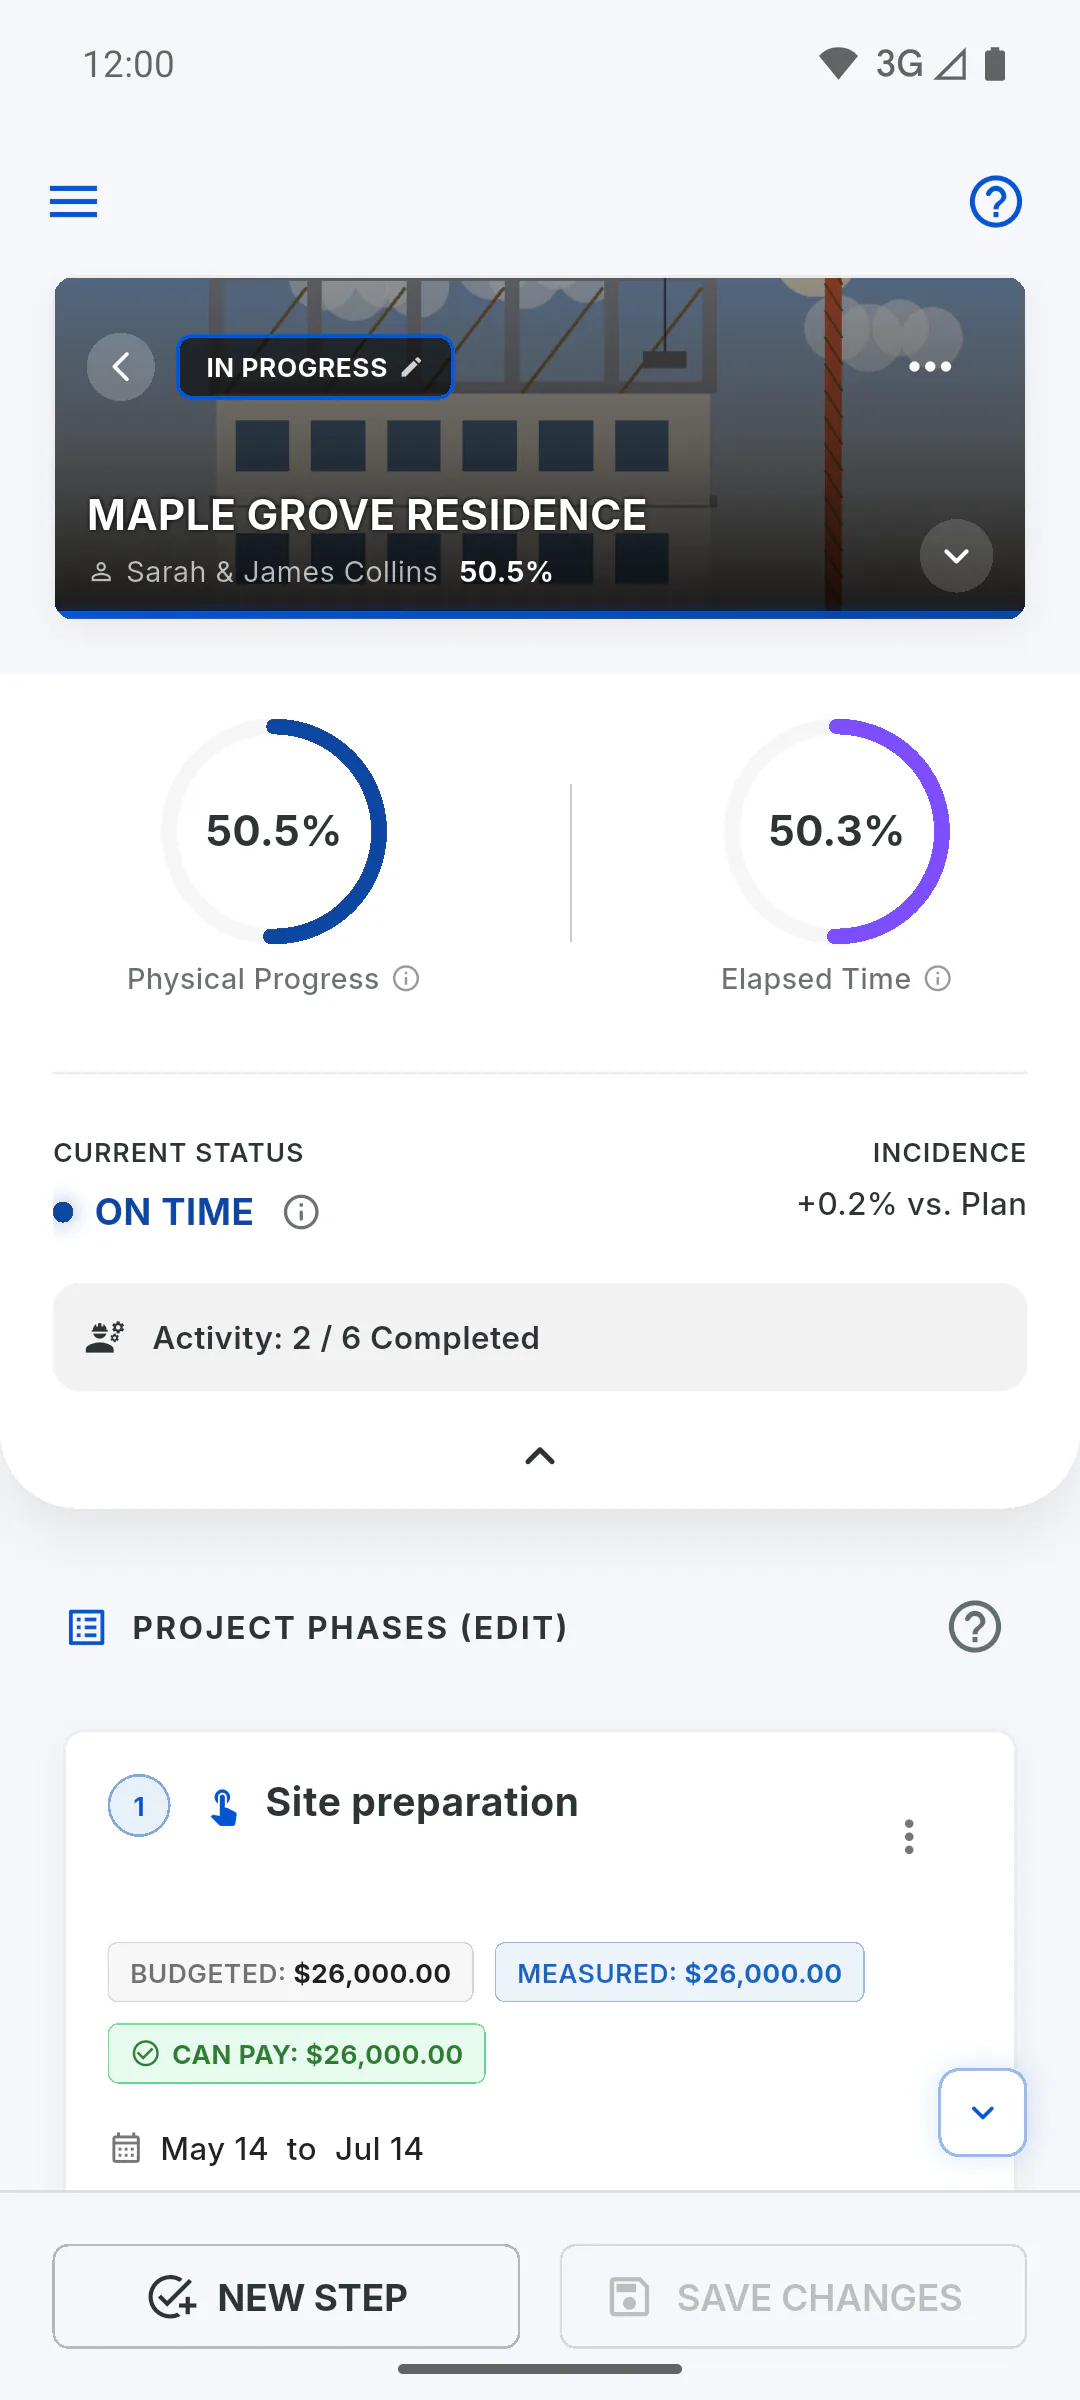
The app compares the two gauges:
- Delayed: physical progress is more than 5 points behind elapsed time
- Ahead: it is more than 5 points ahead
- On Time: the gap is within 5 points either way
Without the project dates, time stays at 0%, so any progress above 5% shows as Ahead.
Step 5: The margin when on time
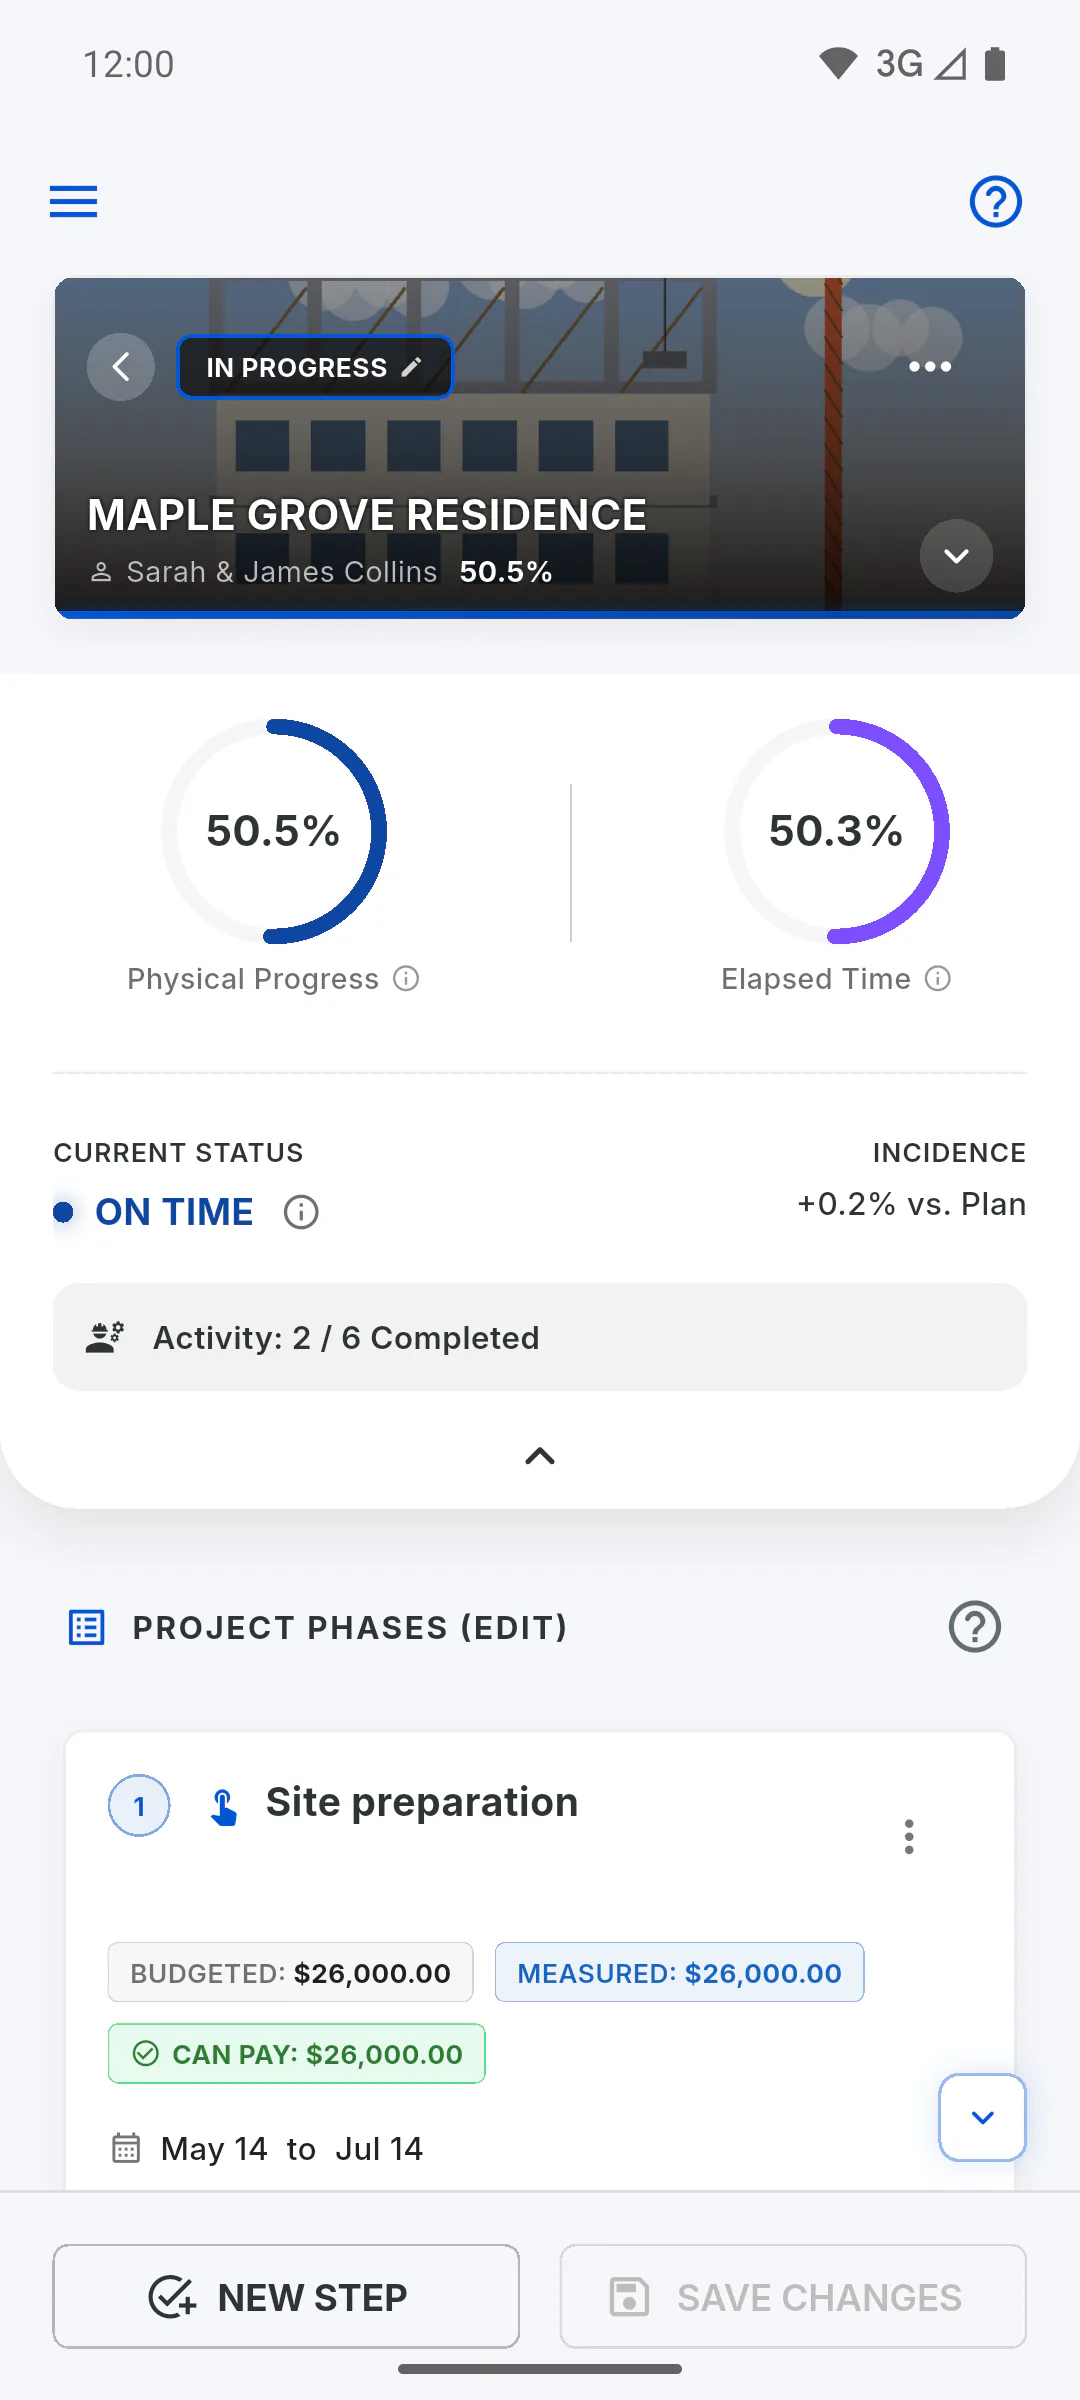
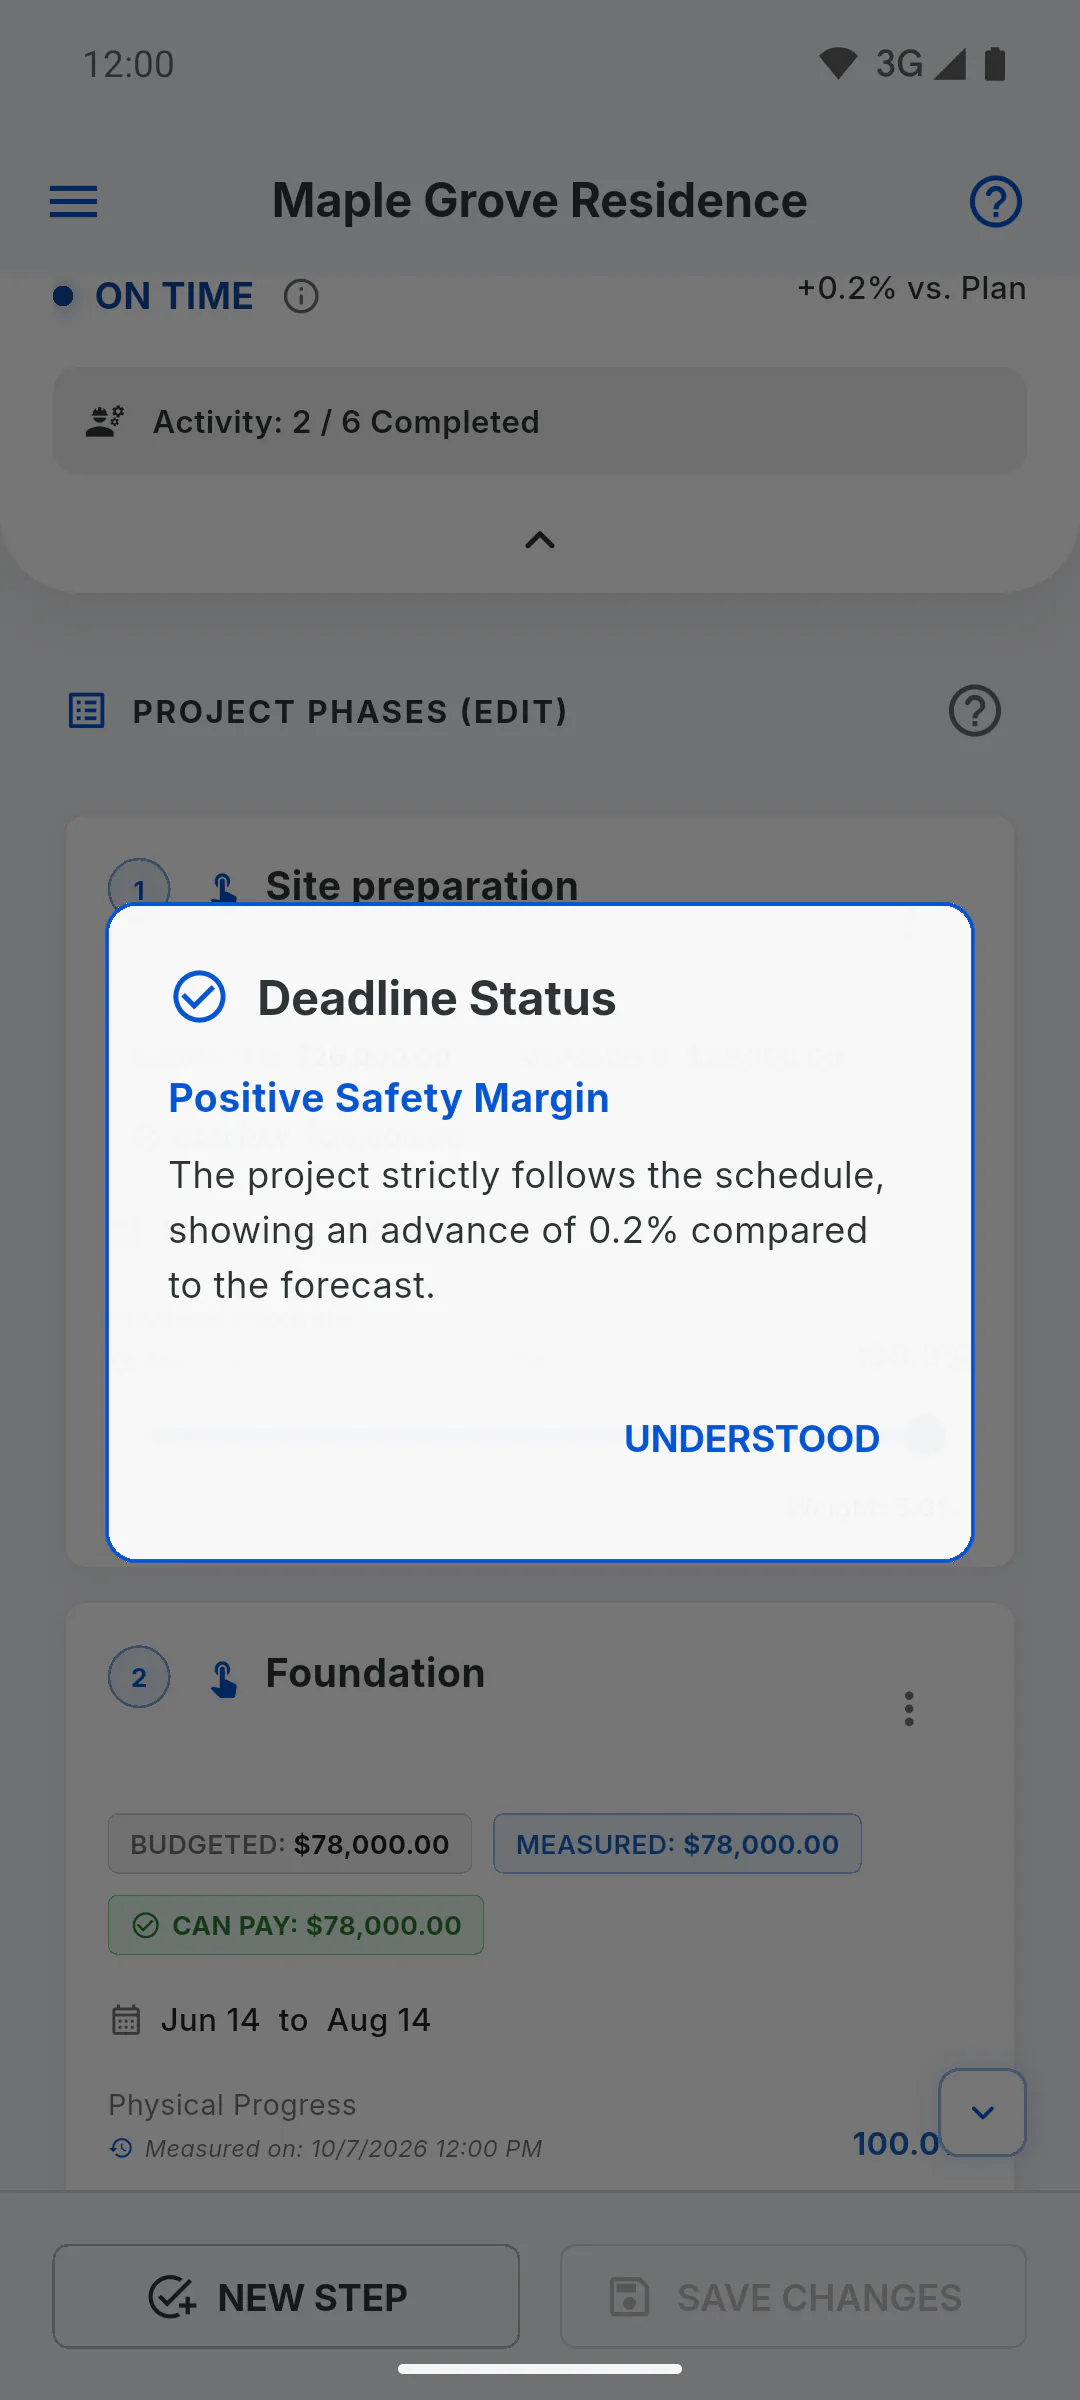
When it says On Time, tap the info icon next to it to open Deadline Status. It shows Attention: Narrow Margin when progress is slightly behind time, or Positive Safety Margin when it is level or ahead, along with the gap as a percentage. Tap Understood to close it.
Step 6: Incidence and completed stages
Under Incidence, the % vs. Plan figure is the gap between physical progress and elapsed time, with a + sign when the project is ahead. The Activity: line shows how many stages have reached 100% out of the total, for example 3 / 19 Completed.
Step 7: When the numbers change
The panel updates as soon as you move a stage's progress, even before you save. To keep the changes, tap Save Changes: How to update stage progress
- The Physical progress card on the Overview tab shows the same number as the panel's Physical Progress, along with the schedule badge (ahead of schedule, on schedule or behind schedule). If the Overview tab still shows an available amount, the project won't reach 100% even with every stage complete, because that part of the contract isn't in any stage yet.
How to read the Physical Progress vs. Elapsed Time panel
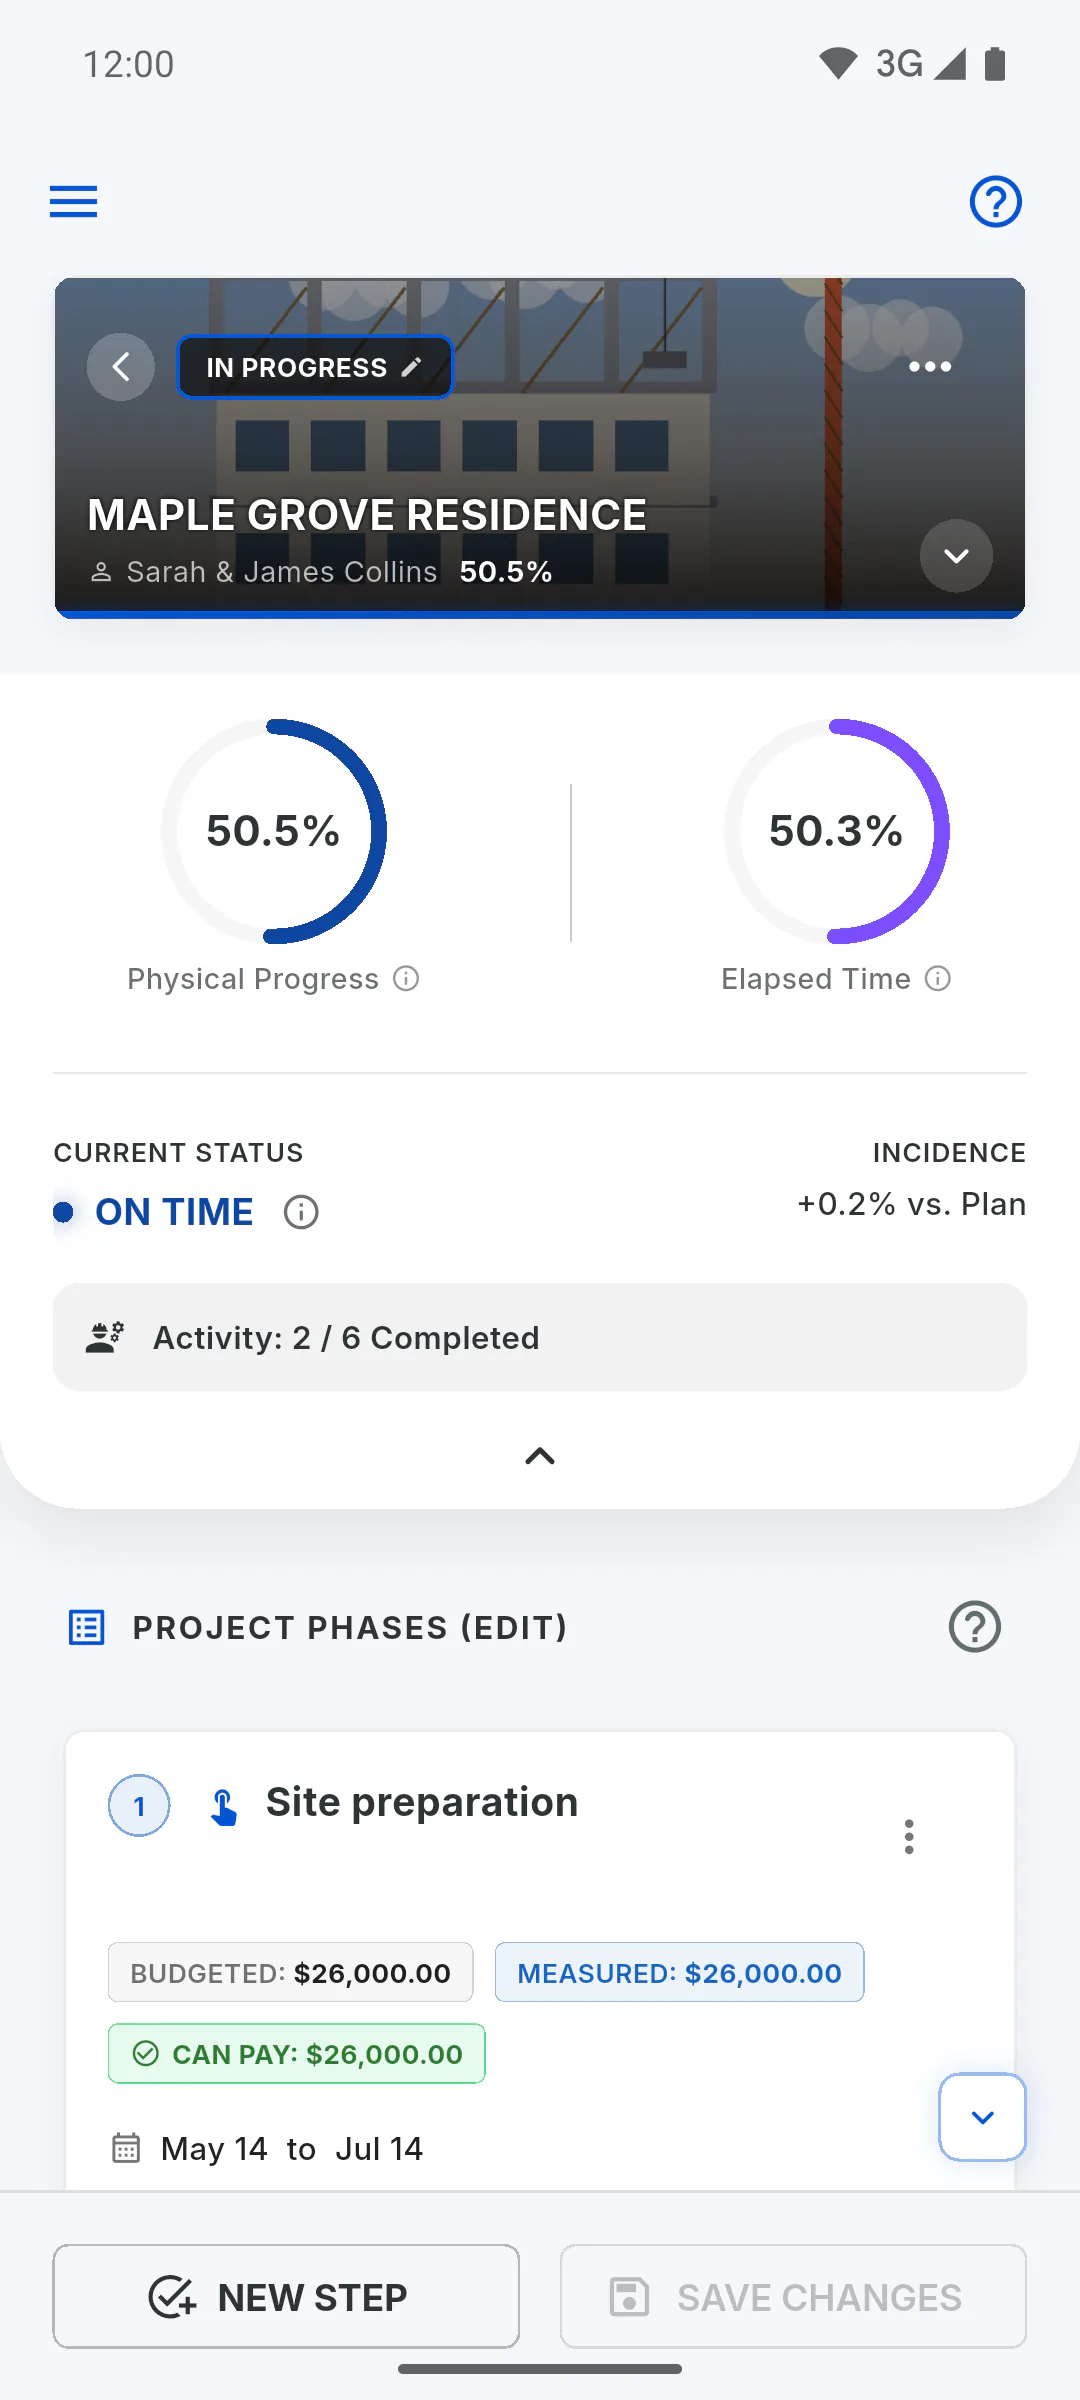
Understand the two gauges at the top of the Schedule and how the app decides whether the project is delayed, on time or ahead.
For managers7 steps
Didn't find what you were looking for?
Chat with support on WhatsApp or open a ticket right in the app.