
Step 1: Open the dashboard
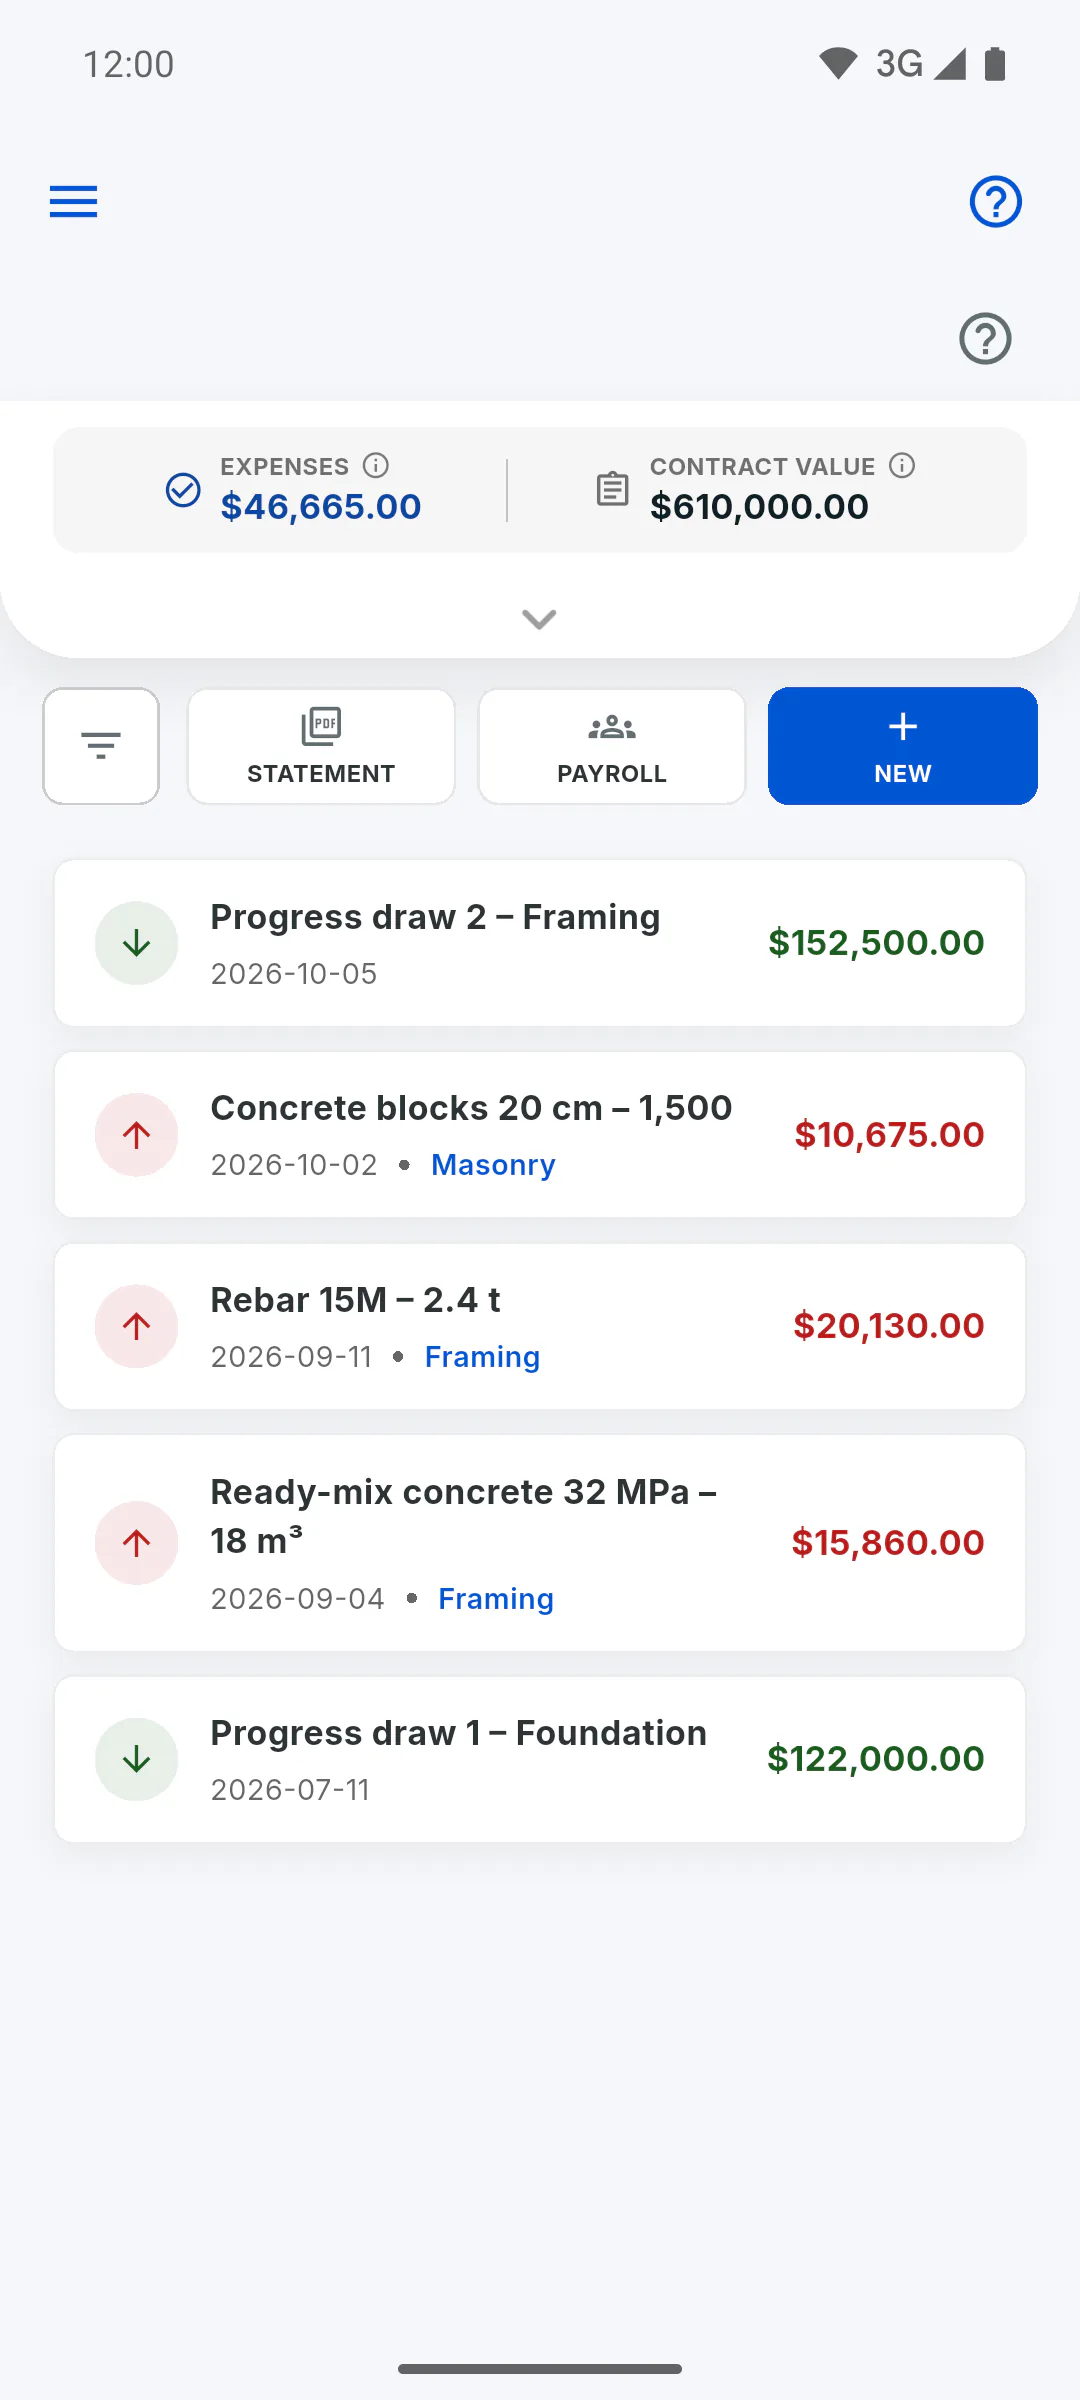
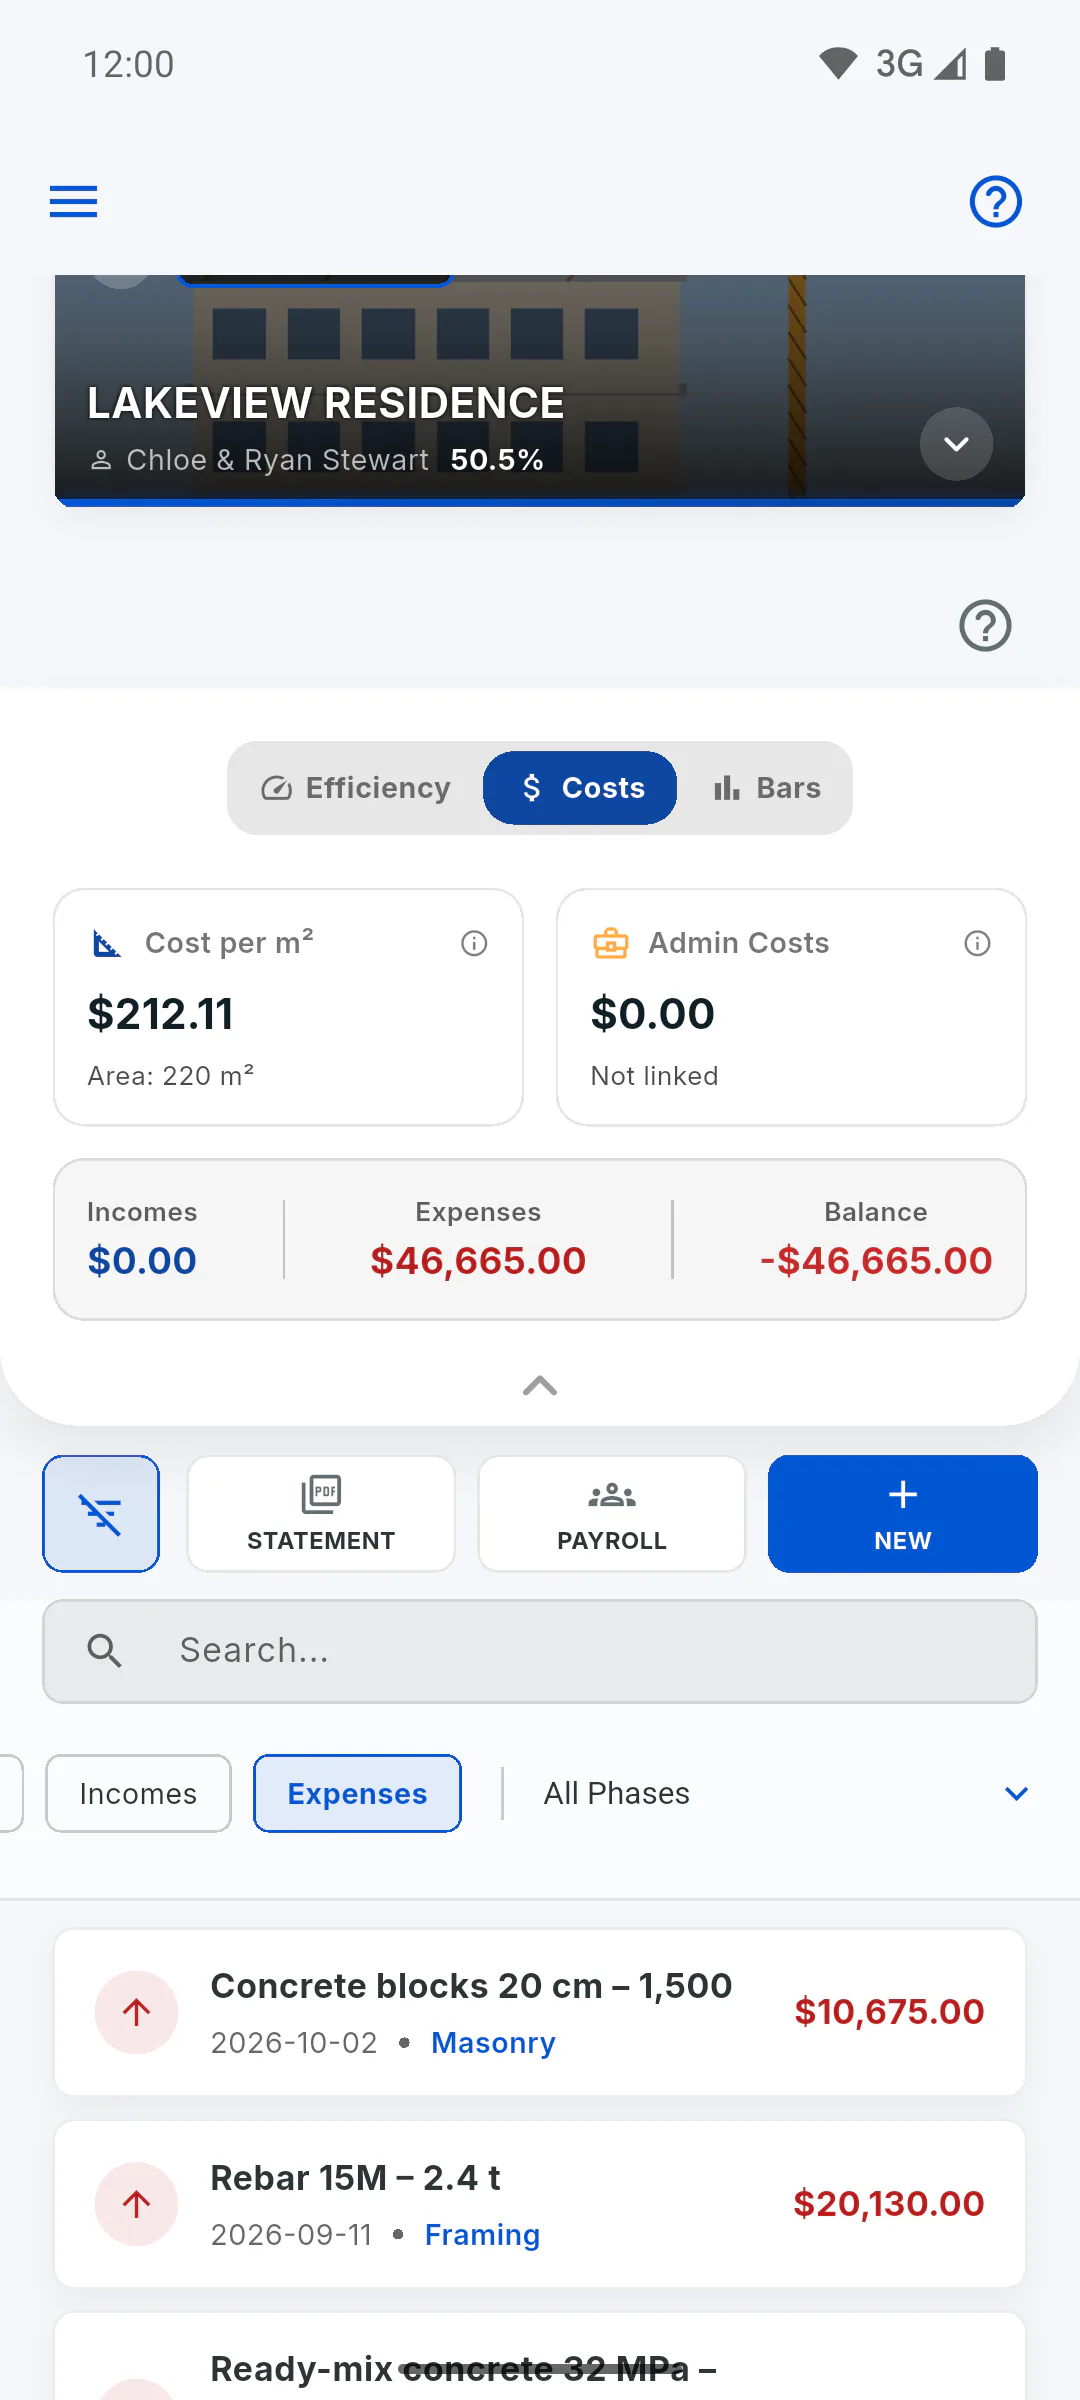
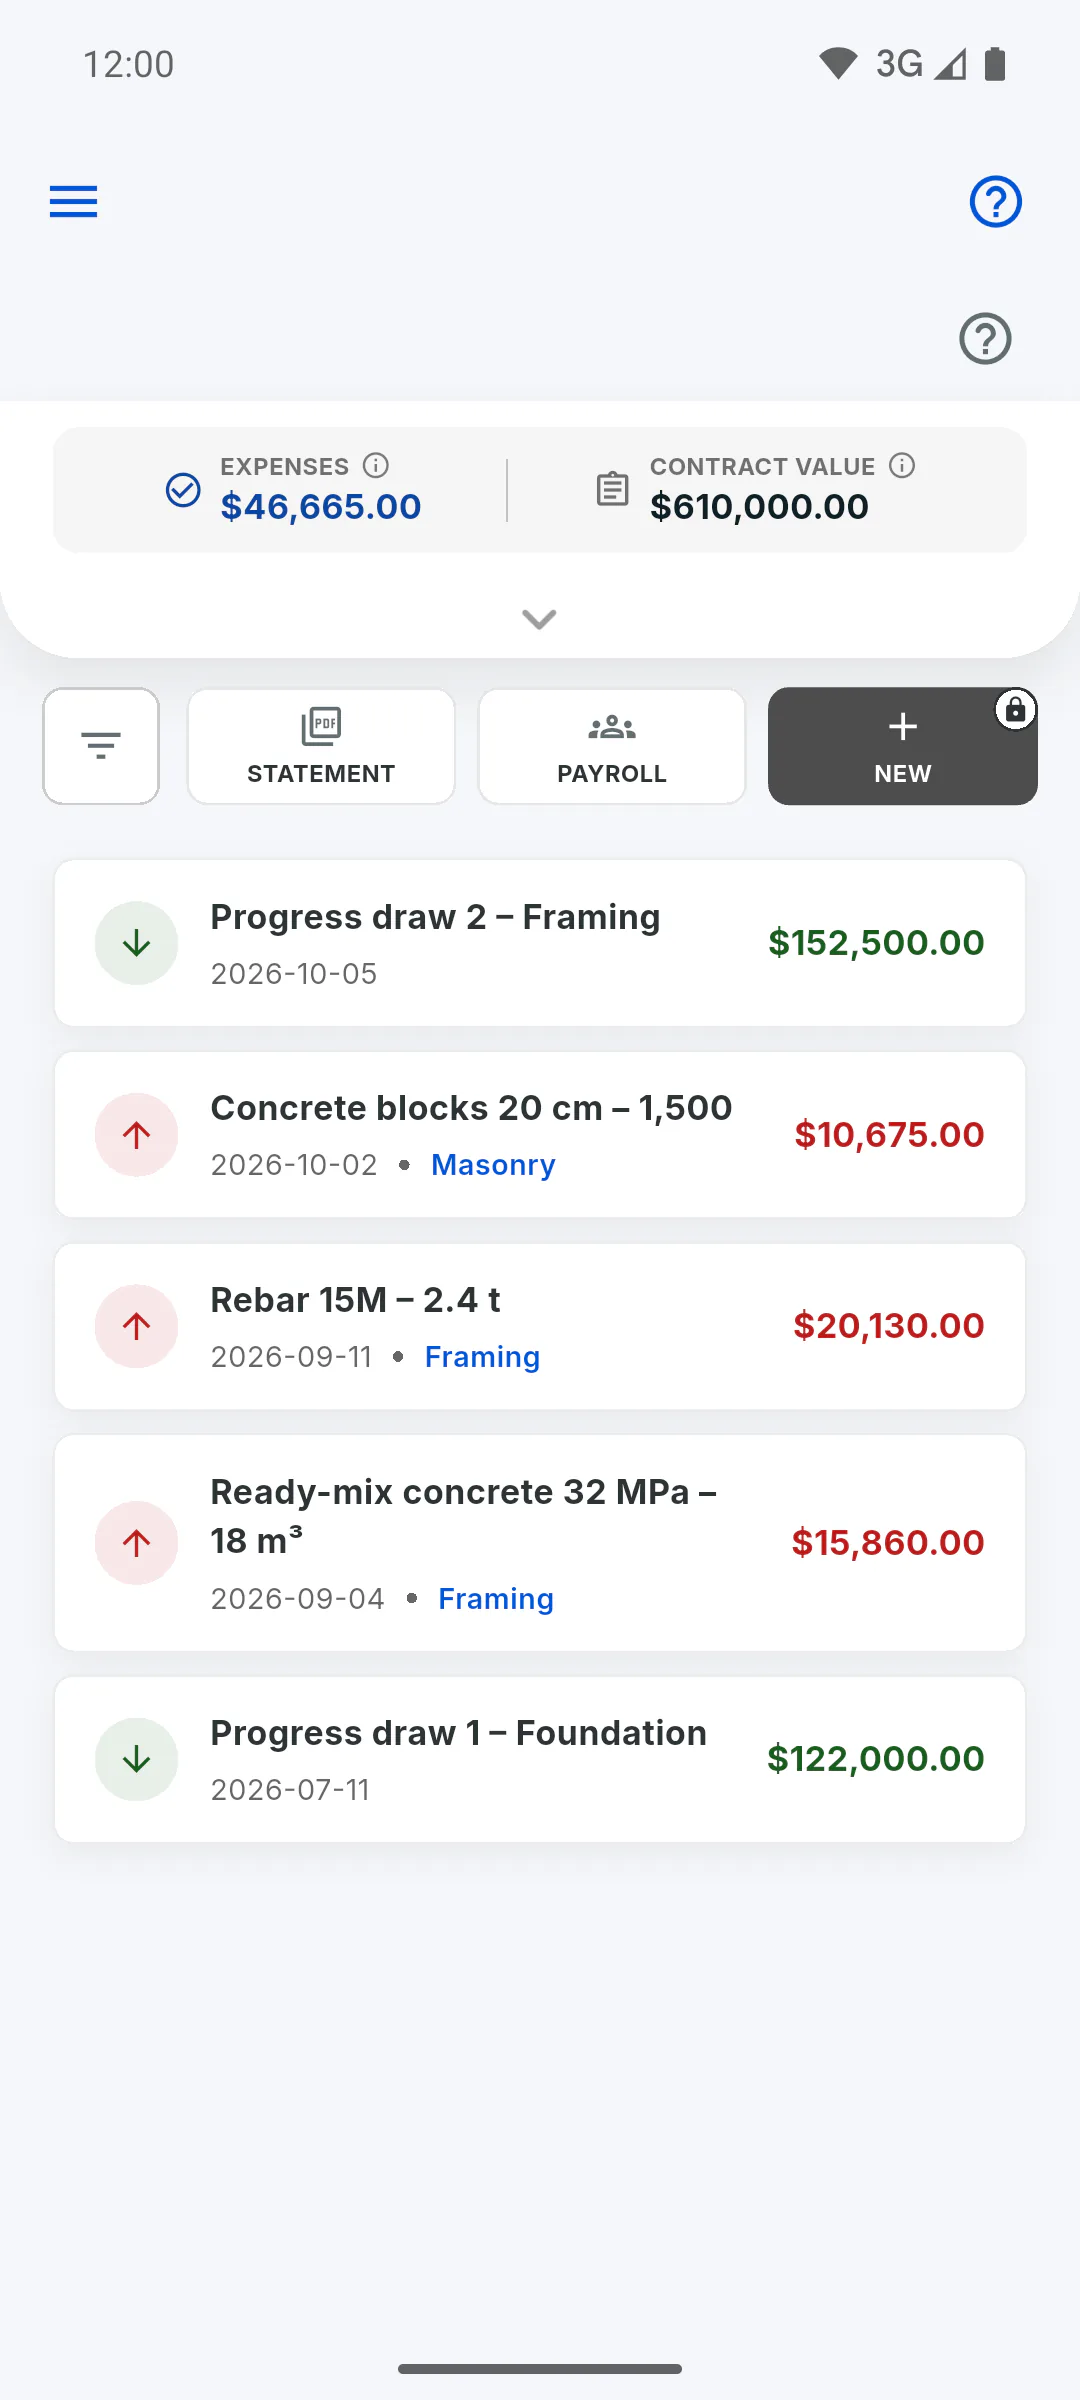
In the project's Financial area, the dashboard is at the top. Collapsed, it shows two numbers: total expenses, labeled Expenses, and the Contract Value. Tap the arrow below them to open the dashboard with the Efficiency, Costs and Bars tabs; it opens on Costs. Tap the info icons to read what each number means.
Step 2: Efficiency
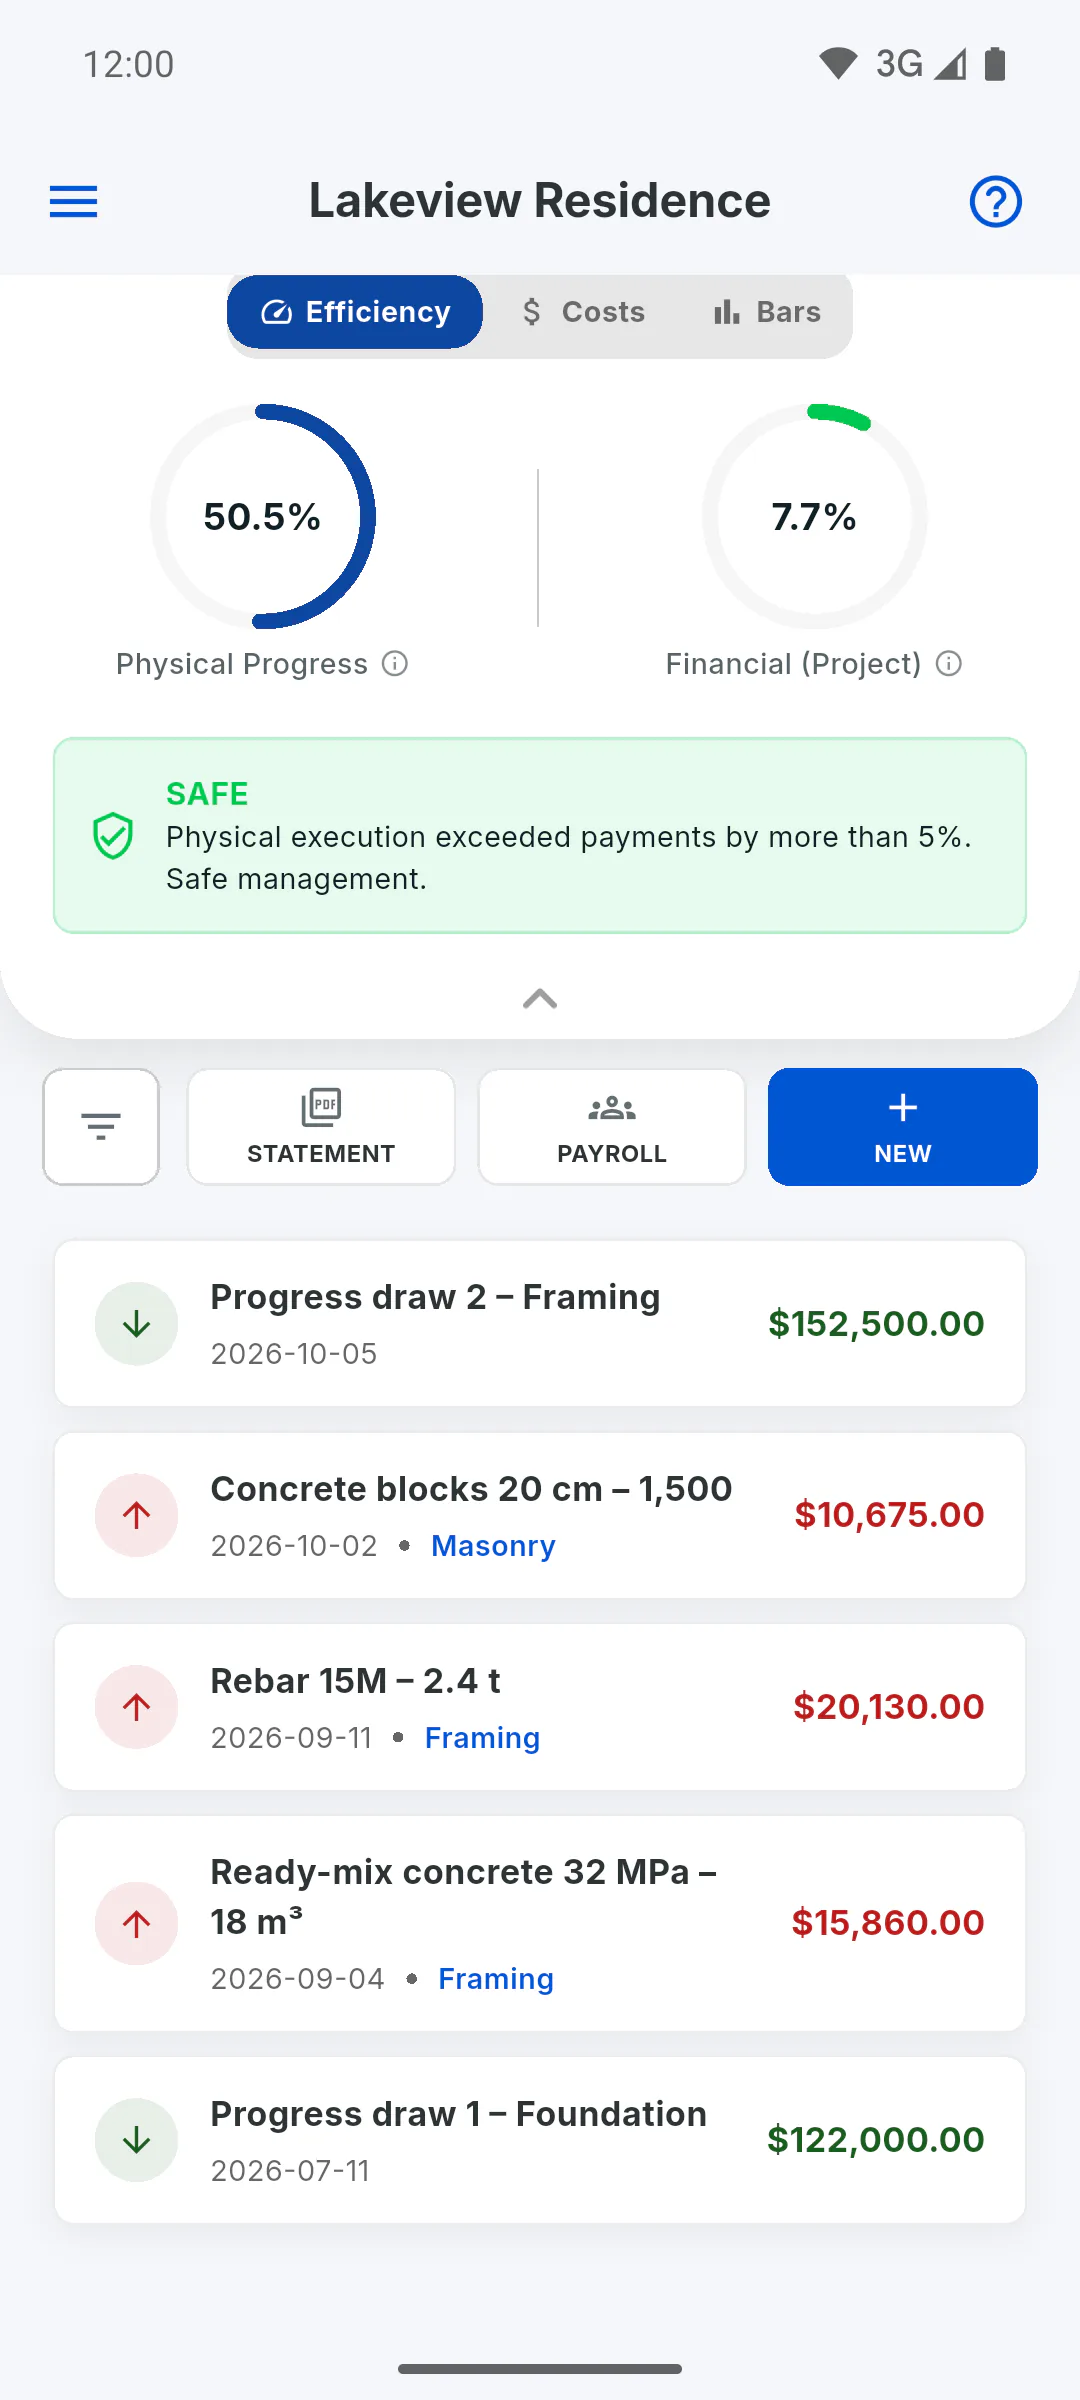
Compares Physical Progress, the project's progress based on schedule stages, with Financial (Project), expenses linked to stages divided by the contract value. Below that you see the status:
- Ahead: financial is more than 5 points ahead of physical
- Safe: physical is more than 5 points ahead of financial
- Balanced: the gap is 5 points or less
Step 3: Costs
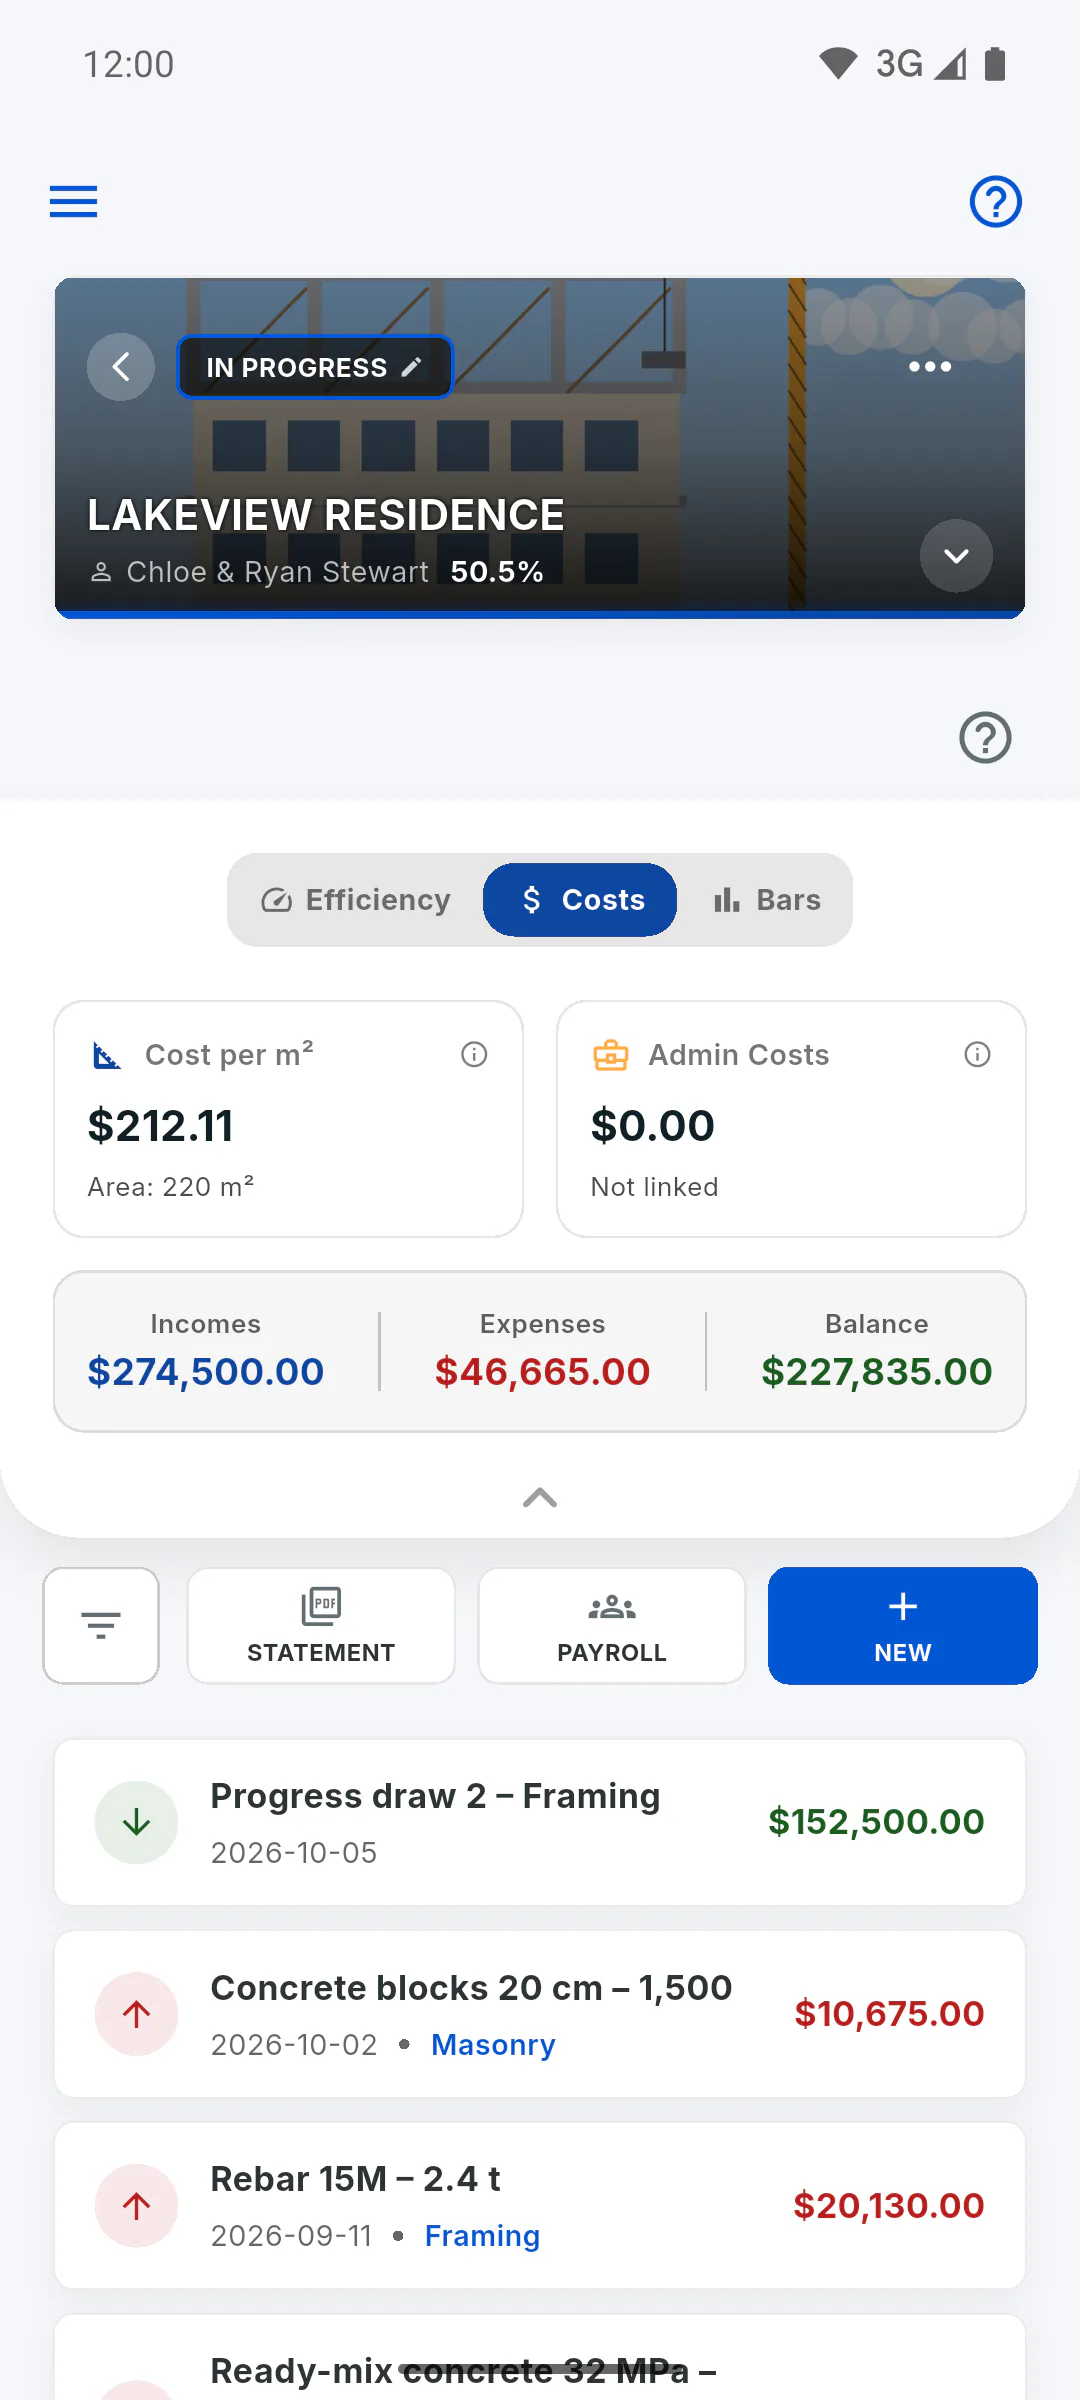
- Cost per m²: all expenses divided by the project area; with no area, you'll see Area not informed; with an account in the United States, Cost per ft²
- Admin Costs: expenses with no stage (Not linked)
- Incomes, Expenses and Balance: total income, total expenses and the difference
Step 4: Bars
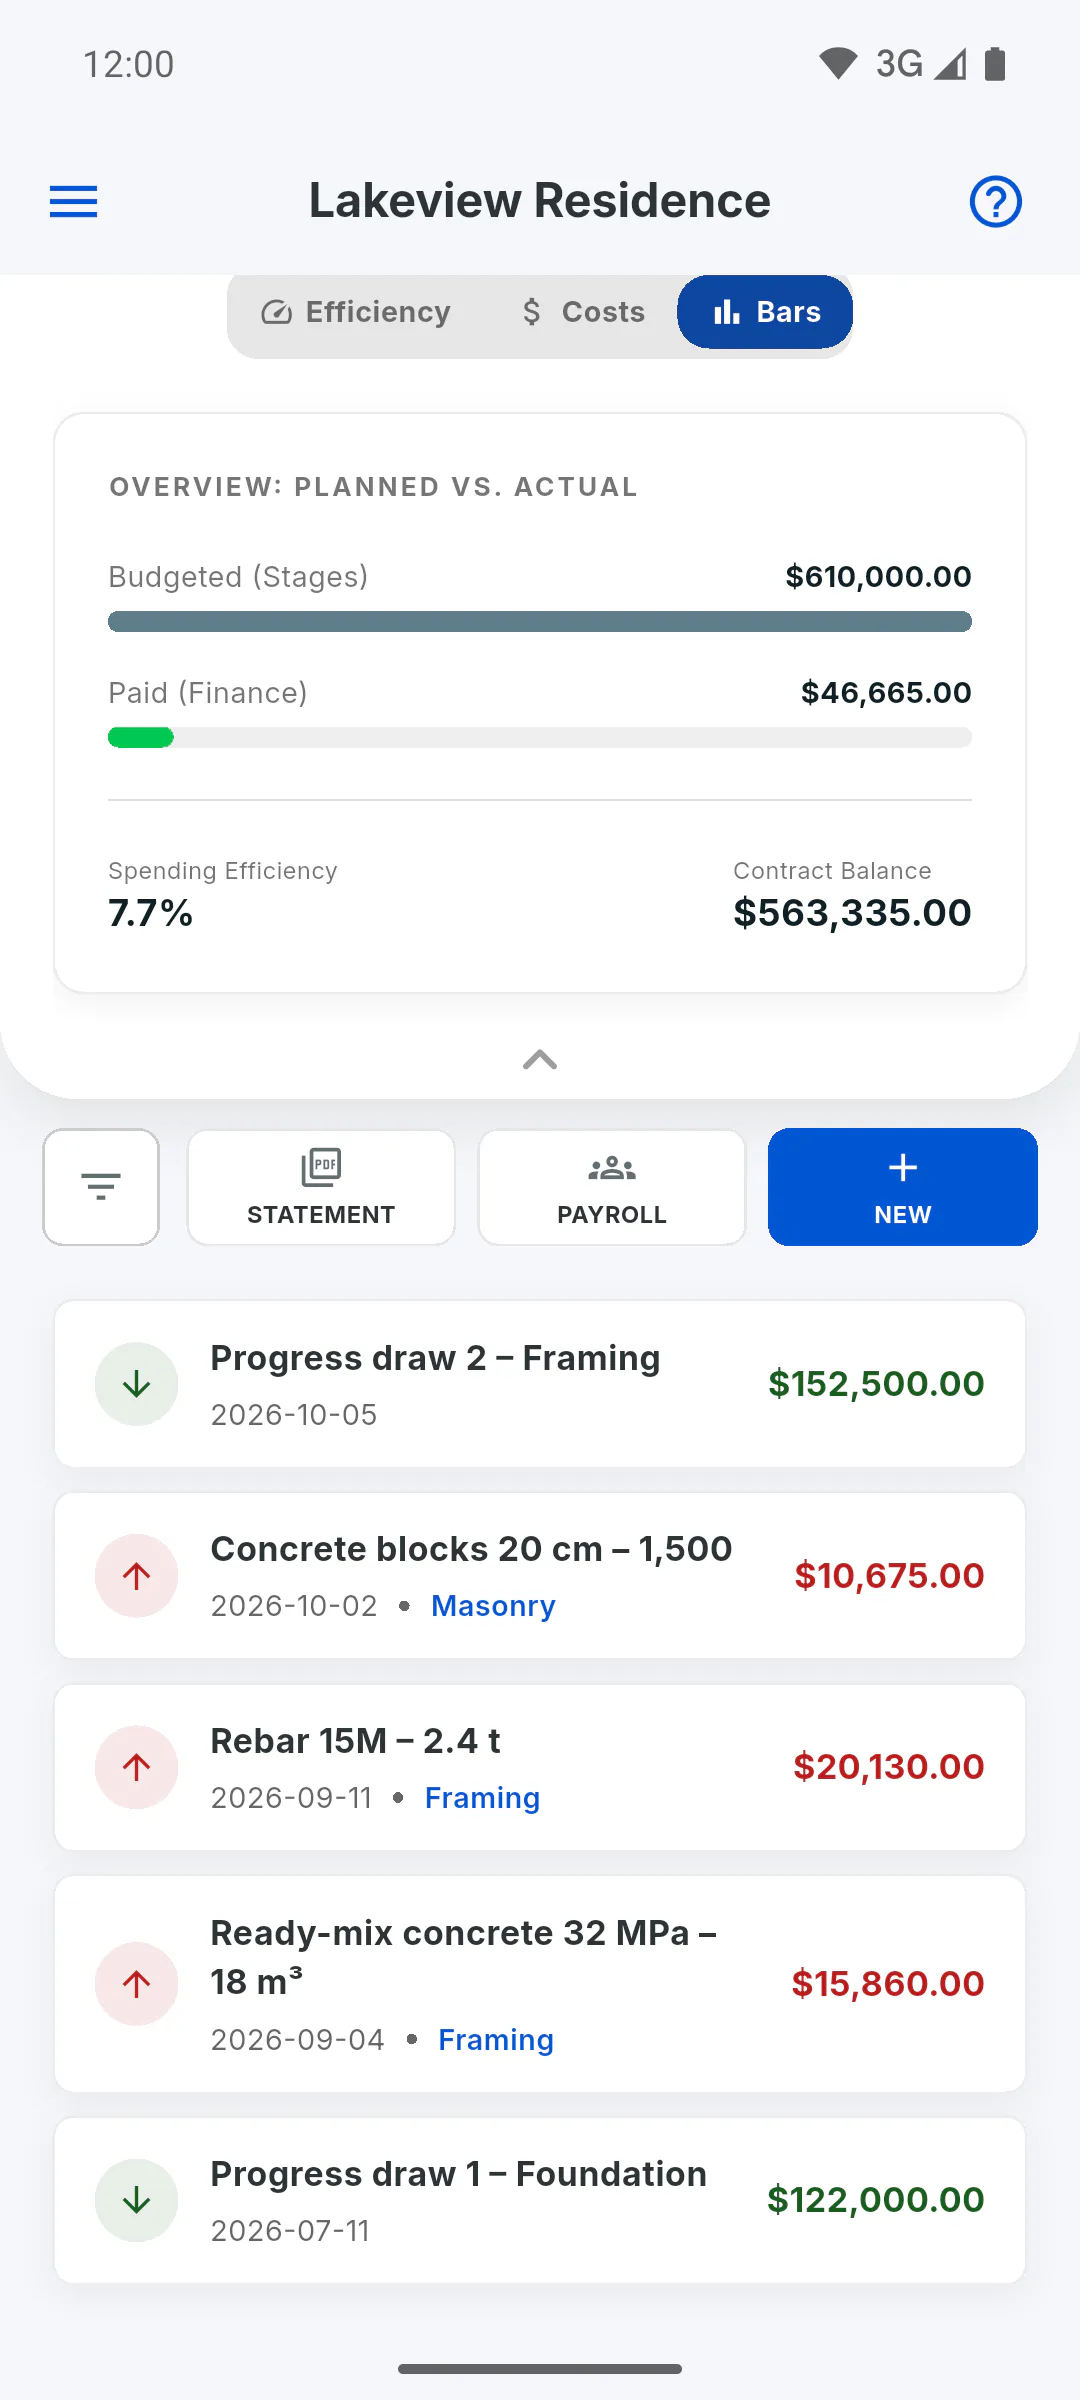
Shows two bars measured against the contract value: Budgeted (Stages), the total planned value of the stages, and Paid (Finance), expenses linked to stages. Below are Spending Efficiency, paid divided by budgeted, and Contract Balance, contract minus paid. The tab shows project totals, not each stage; the amount paid per stage is in the Schedule: What Budgeted, Measured and Can Pay mean
Step 5: Filters change the dashboard
The dashboard only adds up the entries on the list. With a search or a type or stage filter on, every number in the dashboard counts only those entries. Clear the filters to see the whole project: How to filter entries and generate the statement
Step 6: Who sees this dashboard
The dashboard belongs to project management: the owner and an invited engineer. Amounts are in the project currency. The client sees their own summary in the Portal: What your client sees of the financials
How to read the financial dashboard (Efficiency, Costs and Bars)
Understand the numbers at the top of a project's Financial area: the collapsed summary, the Efficiency, Costs and Bars tabs, and why they change with filters.
For managers6 steps
Didn't find what you were looking for?
Chat with support on WhatsApp or raise a ticket in the app.